

In Switzerland, an insurance group called on Qim info to diagnose a gradual decline in the performance of its application system. Using Rapid Performance Diagnosis (RPD), the teams identified the technical causes, proposed concrete actions and restored the fluidity of critical services.
Structured around the expertise of Qim info’s Performance & Observability department and the Dynatrace tool, the mission produces immediate results:
- Complete visibility of the application chain.
- Precise location of slowdowns.
- Recommendations that can be implemented in the short term.
- Measurable improvement in user experience.
Interested in application performance? Discover our complete guide toApplication Performance Monitoring.
Application performance: Basel context
For this Basel-based insurance group, in-house applications play a central role in the day-to-day running of departments. As soon as a slowdown affects critical modules such as the front-end, back-end services or data processing, users immediately feel the effects.
For over 20 years, Qim info has been supporting players in the insurance sector with their IT challenges, through targeted projects or team-building assignments. Today, 27 specialized consultants (developers, business analysts, product ownersQA engineers, UX/UI designers) work with several companies to meet their technical and business needs.
In this context, the insurer was looking for a partner capable of rapidly analyzing the situation and providing complete technical visibility, without disrupting existing environments. Qim info was called in to carry out a structured diagnosis, using advanced supervision tools.
Rapid Application Performance Diagnostics
Rapid Application Performance Diagnosis is an expert approach designed to rapidly identify major malfunctions in an application system. It is based on a combination of field experience, tool-based analysis and precise, directly usable recommendations.
This method is designed for companies faced with:
- Sudden or recurring performance problems.
- Loss of fluidity in critical processes.
- A lack of visibility on the actual behavior of their applications.
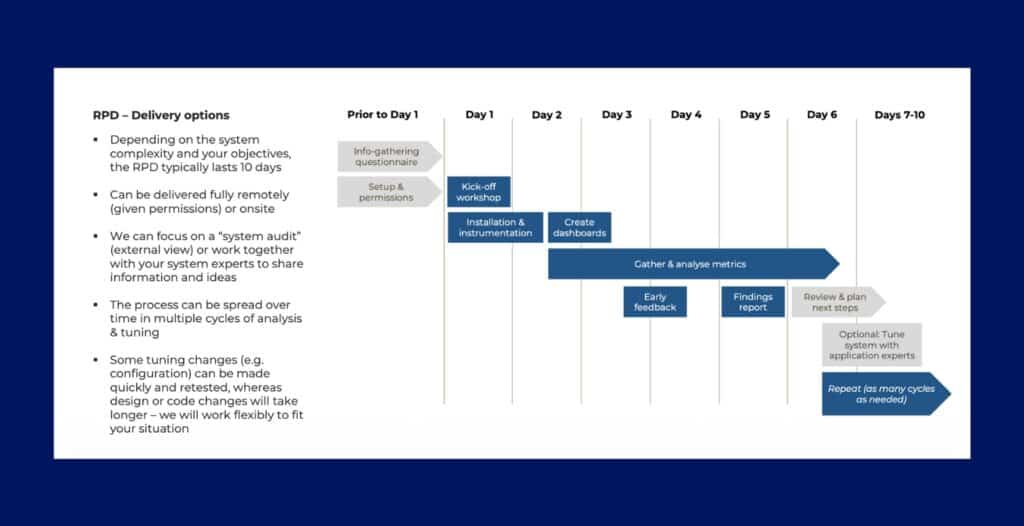
DRP can be adapted to any type of environment: hybrid architectures, cloud, packaged solutions or in-house developments. Qim info can work with its own tools, or use those already in place at the customer’s site.
Depending on the objectives, diagnostics can be carried out on-site or remotely, in a short, iterative and flexible process. Some corrective actions, such as configuration adjustments, can be implemented as early as the first analyses, while others, more structural, require a progressive optimization plan.
Customized application diagnostics: fast method and advanced supervision
In the case of the Basel-based customer, Qim info deploys a Rapid Performance Diagnostic (RPD) to analyze application slowness and restore the fluidity of critical services. The intervention is led by a specialized team comprising a
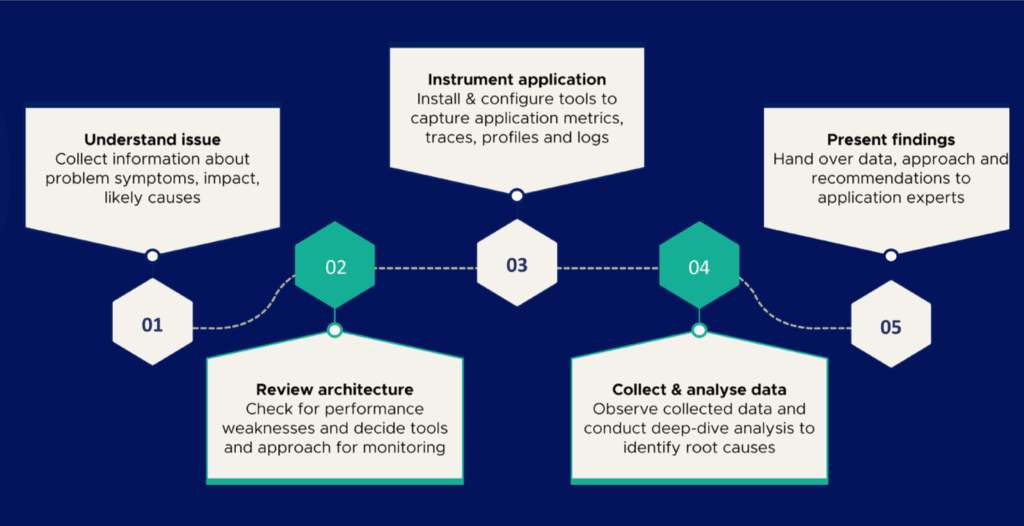
This approach is structured around five phases:
- Understanding the problem: gathering information on symptoms, impact and possible causes of slowness.
- Architecture review: analysis of technical components to identify potential weaknesses and define the supervision strategy.
- Instrumentation: installation and configuration of measurement tools (metrics, logs, traces, etc.).
- Data collection and analysis: observation of application behavior and in-depth analysis to identify technical causes.
- Presentation of results: presentation of findings, approaches and recommendations to business and technical experts.
Throughout this process, our consultants work closely with in-house teams to document priority use cases, activate the right technical levers and deliver a complete deliverable, with concrete, prioritized recommendations.
Application mapping: analysis of key components
After gathering the necessary information on the symptoms observed, their impact and probable causes, Qim info consultants carry out a detailed analysis of the application architecture. This enables us to map the various technical components involved in the slowdown. Each element is examined individually, but also in its interactions with others, to identify potential areas of friction:
- Front interfaces.
- Back-end services.
- Network layer.
- Database.
This precise mapping guides technical investigations and enables us to quickly target the components to be instrumented.
Application monitoring with Dynatrace
To support their analysis with factual data, Qim info consultants rely on Dynatrace, an advanced observability platform. It provides a real-time view of how applications and infrastructure are performing.
Dynatrace automatically detects anomalies, measures response times at every stage of the user journey and identifies dependencies between services. As a result, consultants can track the entire lifecycle of a request, from the user interface to the database, and quickly pinpoint the source of any slowdowns.
Qim info has been an official Dynatrace partner since 2016, and for this type of mission mobilizes experts certified in the exploitation of its key functionalities: Real User Monitoring (RUM), log analysis, APM, synthetic monitoring, application security, etc.

Analysis of technical causes
Once the environment has been instrumented, the data collected can be used to confirm malfunctions and pinpoint their causes. In the present case, several anomalies are highlighted:
- Redundant API calls.
- Overloading certain microservices.
- Poor network configuration.
- Poor practices in the handling of certain events.
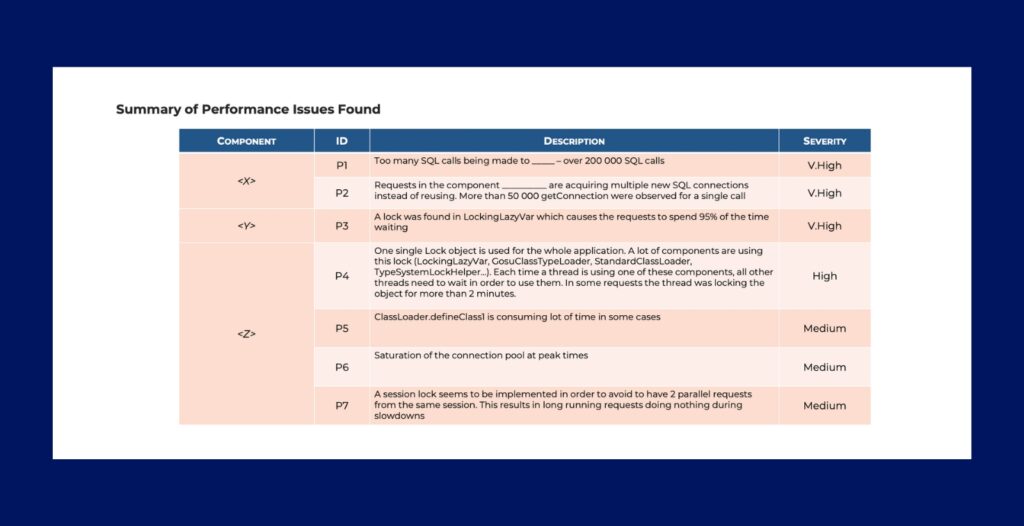
These findings are in line with those of other similar projects. DPR regularly reveals more complex bottlenecks, such as saturation of connection pools, class locks generating waiting times, or over-solicited SQL queries having a major impact on overall responsiveness.
Technical recommendations to improve performance
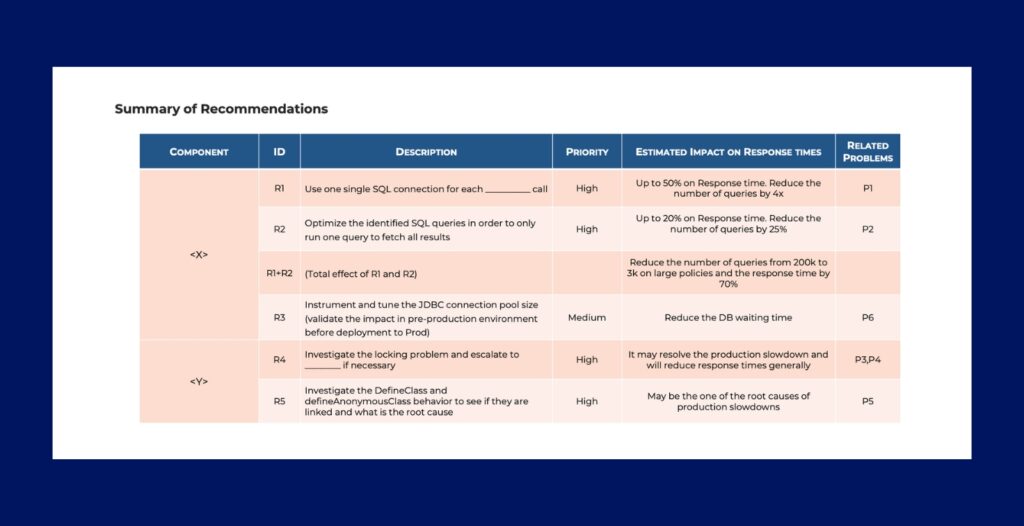
Based on these findings, Qim info delivers a structured deliverable containing concrete recommendations, classified according to urgency and impact. This action plan enables the customer to rapidly implement corrective measures, while preparing for longer-term optimization.
Proposed measures include:
- Caching of certain API calls: to limit redundant requests and lighten the infrastructure.
- Adjustment of scaling parameters: to dynamically adapt the resources allocated to the most-used microservices.
- Targeted revision of network configuration: to improve exchanges between services and reduce latency.
Diagnostic results: visibility, fluidity, performance
Once the deliverable has been delivered and the recommendations shared, the customer has all the information he needs to act quickly and effectively. The diagnosis provides:
- A clear overview of the technical environment.
- A prioritized action plan.
- Visibility into the origin of slowdowns.
- A better understanding of the system’s weak points.
In addition to resolving the slowness observed, Qim info’s intervention initiated a continuous process of application performance improvement.
IT observability: Qim info expertise in Switzerland
Qim info works with companies of all sizes and in all sectors to improve the reliability of their IT systems and the performance of their applications.
Our application performance consultants provide:
- Perfect command of observability tools (Dynatrace, AppDynamics, Grafana).
- A results-oriented, collaborative approach.
- Ability to dialogue with both technical and business teams.
With more than 2,000 performance engineering projects completed, Qim info has established itself as a benchmark player in the world of application supervision.
With offices in Basel, Geneva, Lausanne, Zurich, Annecy and Lyon, the company operates throughout Switzerland and France, adapting to the specific needs of each organization.
Thanks to their technological versatility (Dynamics 365, Azure, SharePoint, Databricks, GraphTalk AIA, UX/UI, etc.), Qim info teams can quickly integrate into complex environments and offer tailor-made solutions.
Click here to learn about a Swiss tax authority that used Qim info’s services to modernise the supervision of its business applications.
Qim info services: IT supervision, diagnostics and performance
Are you experiencing unexplained application slowness? Do you need a fast, clear and actionable diagnosis? Qim info’s Rapid Performance Diagnostic will help you get back to optimum performance, combining responsiveness, expertise and transparency. Contact our experts.
Interested in IT performance management? Read our dedicated article.