

Performance is essential to the effectiveness of your web applications and can be measured using specialized tools. Discover the factors and best practices for improving the performance of your web applications. Learn more in our article on continuous performance engineering, available here.

Plan for the next traffic spike on your e-commerce site
Contents
Why is web application performance increasingly important?
The impact of performance on user experience
These days, we’re hyper-connected, whether via our computers, tablets or smartphones. With the rise of 4G, 5G and fiber optics, user expectations have evolved considerably over the years.
End-users have become impatient and much less tolerant of loading times. When they launch an application or access a web page, if it loads too slowly, they don’t hesitate to leave the application or site immediately. Not only can this lead to lost sales by reducing conversion rates, it can also drive users to a competitor. What’s more, this slowness generates frustration, compromising the user experience.
Performance on mobile has become paramount with the rise in mobile traffic. A slow application on mobile will frustrate users looking for a fluid experience.
💡 Performance monitoring helps improve your applications.
The relationship between performance and SEO
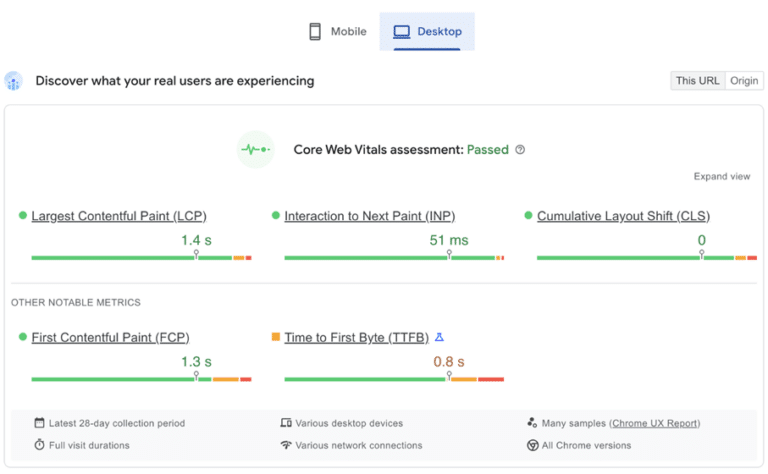
When it comes to SEO, Google (and other search engines) are placing increasing emphasis on website performance. To this end, indicators such as Core Web Vitals were introduced by Google in 2021 to measure this performance:
- Largest Contentful Paint (LCP):
It measures the loading time of the page’s main content. A PCL of less than 2.5 seconds is recommended to guarantee a good user experience.
- Interaction to Next Paint (INP) :
It evaluates the responsiveness of the page during interactions. An INP of less than 200 ms is considered good. Between 200 and 500 ms, responsiveness needs to be improved, and above 500 ms, the page is considered unresponsive.
- Cumulative Layout Shift (CLS) :
It measures the visual stability of the page. A CLS of less than 0.1 is considered good, ensuring that elements do not move unexpectedly during page loading.
Web performance is now crucial, both in terms of loading speed and user experience. The various aspects of performance, as measured by the Core Web Vitals, play a key role in improving a brand’s visibility and credibility. By investing in performance optimization, companies can not only strengthen their search engine rankings but also boost sales by increasing their conversion rates.
Factors influencing web application performance
Page loading time
Page load times can have several impacts, both human and financial:
- User experience:
– Loading times have a direct effect on the user experience. Since the democratization of 4G, 5G and fiber optics, users have become increasingly impatient. It’s crucial to display content quickly, otherwise users are more likely to leave the site. Browsing a slow site also discourages users from exploring further.
– According to a Deloitte study, there is an 8% increase in page views per session when the site is responsive. - Conversion rate:
– For e-tailers, every click and every second of loading is essential to finalize a sale. A high-performance site facilitates navigation and improves the chances of conversion.
– Also according to Deloitte, an 8.4% increase in conversion rates was observed on the best-performing mobile sites. - SEO:
Page load times now have a direct impact on search engine rankings, particularly due to Google’s Core Web Vitals metrics, which measure various aspects of a website’s performance.
Image and resource optimization
The use of images and resources is a recurring theme in many web applications. To optimize this aspect, it is essential to use image formats adapted to the web, such as WebP or AVIF. These formats offer excellent image quality while having smaller file sizes than traditional formats, which improves performance and reduces loading times.
Database management
It’s important that the database is indexed and optimized, and the use of caching solutions such as Redis can considerably speed up response times, especially for high-traffic sites. Database management can be optimized in a number of ways:
- Cache: Setting up a Redis can considerably speed up response times, especially for high-traffic sites.
- Indexing: The placement of an index on columns that are often queried. Indexing speeds up searches and reduces response times. It is also important to check that indexing has been properly configured, otherwise certain operations may be slowed down.
- Query response time: When querying the table, it’s important that queries are optimized. If they aren’t, this will slow down execution and data retrieval.
- Design: It’s important that the database is optimally designed, as poor design leads to heavy, complex queries, which considerably slow down performance.
Read our articles on custom software development and custom software builders to learn more about the design process.
Tools for measuring web application performance
Google Lighthouse
Google Lighthouse is an open-source tool developed by Google that enables performance audits for web applications, both desktop and mobile. It provides a detailed report including Core Web Vitals, key indicators that measure the quality of the user experience.
This powerful and comprehensive tool helps optimize loading speed and provides an overview of the application, while identifying areas for improvement. Thanks to its recommendations, developers can take concrete steps to improve their site’s performance and user experience.
GTmetrix
GTmetrix is a performance analysis tool similar to Google Lighthouse, but with additional features to help measure site loading speed and SEO. It offers the possibility of simulating site performance with connection speed, browser type and localization, making it possible to test a site via several configurations
Its use is complementary to Google Lighthouse.

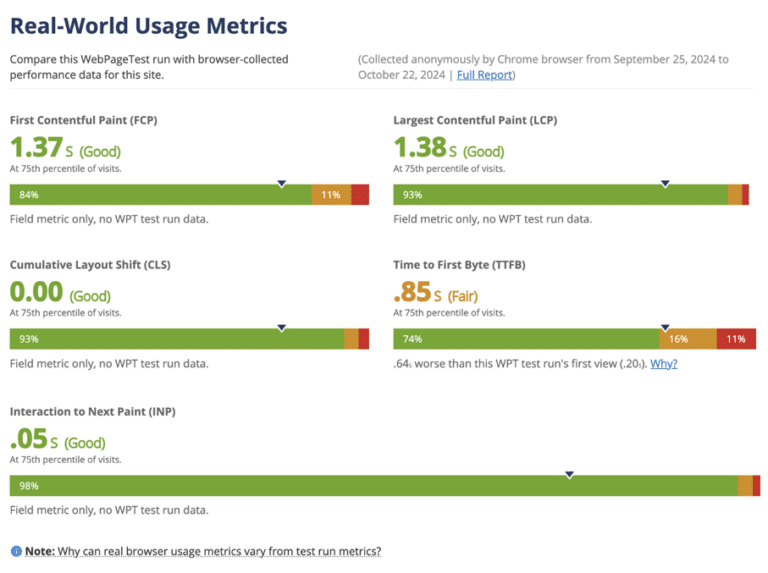
WebPageTest
Just like Google Lighthouse and GTmetrix, WebPageTest will provide a detailed report on Core Web Vitals, simulating configuration (location, browser, etc.).
However, it does allow you to test page loading speed and obtain highly detailed data on every stage of the loading process.
Plan for the next traffic spike on your e-commerce site

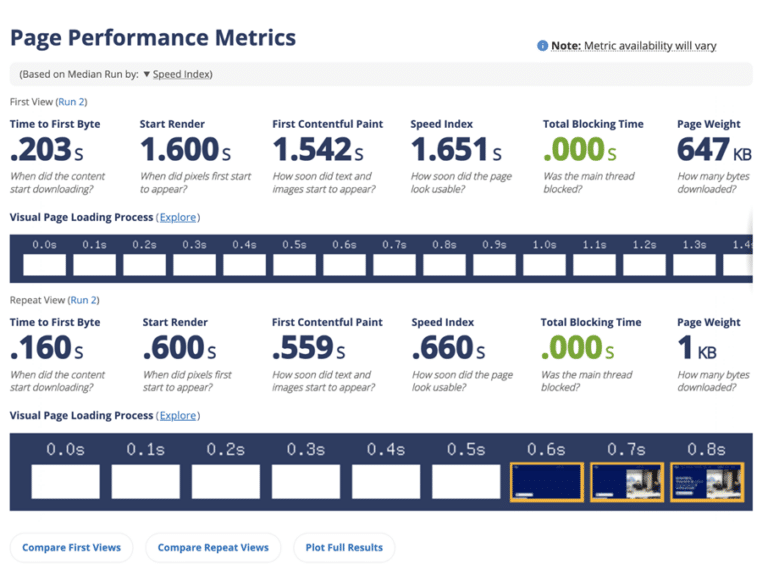
Overall, Google Lighthouse is an open-source tool from Google that evaluates web performance, accessibility, and SEO through detailed audits, while GTmetrix offers an analysis that focuses more on performance and includes continuous monitoring. WebPageTest stands out for its highly detailed tests under real-world conditions, with advanced customization options to simulate different connection speeds.
Best practices for improving web application performance
Reduce file size
Compression is essential for reducing file size. When sending files from the server to the client, techniques such as GZIP or Brotli can be used to compress them, reducing their size by 50-70%. For images, optimization involves using modern formats such as WebP or AVIF, which offer more efficient compression while preserving excellent visual quality.
Setting up efficient caching
Caching is an effective way of improving performance by storing site resources (HTML, CSS, JavaScript files, images, etc.) locally on the user’s device or on the server. On subsequent visits, the browser or server does not need to reload these files, which reduces response times and considerably improves the user experience.
Optimizing JavaScript and CSS scripts
JavaScript and CSS files can be optimized in several ways:
- File minimization :
Minifying JS and CSS files reduces loading times by removing unnecessary spaces, comments and characters. This makes files lighter without altering their functional content.
- Concatenating files :
Combining several JS or CSS files into a single file reduces the number of HTTP requests. This simplifies and accelerates the loading of resources on the site.
- Lazy Loading :
Load JavaScript and CSS files only when necessary. For example, lazy loading delays the loading of scripts until they are required for user interaction, optimizing initial performance.
- Using the cache :
The cache is an effective solution for speeding up loading times by storing JS and CSS files locally. This eliminates the need to reload them on each visit, improving overall application performance.
Qim info helps you improve the performance of your web applications
Drawing on their expertise in web development and application performance, the teams at Qim info ensure that your web applications deliver consistent, optimized performance that is perfectly aligned with your business needs.
When you choose Qim info, you’re banking on optimizing the performance of your web applications, boosting your conversion rate while offering a fluid user experience in line with today’s web standards.