
Identifying anomalies, querying data using natural language, and speeding up diagnostics: observability platforms incorporate AI to expand the scope of what teams can analyze.
To what extent can we rely on these tools, and what information do they need to provide useful answers?
Our experience shows that their effectiveness depends largely on the quality of the information made available to them. An experiment by Grafana illustrates this: an AI agent was evaluated with and without access to the Knowledge Graph, the context layer of Grafana Cloud that maps system components, their relationships, and their operational status.
When analyzing a replayed real-world incident, the agent identified the correct cause in 15 out of 16 attempts using the graph, compared to 1 out of 16 using telemetry alone. However, in another incident, adding the graph did not result in any significant improvement.
Based on these results and feedback from the field gathered by the Qim info teams, we’ll examine the use cases, prerequisites, and methods for evaluating AI for observability in your environment.
Key takeaways:
- AI can automate specific tasks. Its role goes beyond that of a conversational assistant.
- Context matters just as much as the available metrics when interpreting a result.
- A plausible diagnosis still needs to be verified.
- The permission granted to AI to analyze data does not constitute permission to act.
What is the role of AI in an observability approach?
Beyond the time saved, AI makes it possible to perform analyses that would be difficult to carry out manually:
- identify anomalies in multidimensional data,
- explore very large volumes of logs,
- understand code written in a language the team is not very familiar with.
These capabilities open up new avenues for identifying and resolving problems.
Detect anomalies and group related alerts
AI makes it possible to identify anomalies that fixed thresholds would miss by analyzing the system’s typical behavior.
Example: An application may slow down without exceeding its alert threshold. If it typically responds in 100 to 200 ms and consistently takes 600 ms, a threshold set at one second will not trigger an alert; however, a model that analyzes its typical behavior can detect this deviation.
AI also helps us review alerts related to the same incident together. A failure can trigger a cascade of symptoms:
Let’s imagine:
- a database that is slowing down;
- the APIs that query it take longer to respond;
- user requests eventually time out.
Should we open three separate investigations?
The tool can correlate these signals by examining their timeline and the dependencies between components. The team then has a set of symptoms to examine collectively. And above all, remember that “correlated” does not mean “proven cause.”
These use cases are documented by Dynatrace for behavioral baselines and anomaly detection.
💡Qim info’s advice: Focus on the challenges your teams face. Are some issues slipping under the radar? Evaluate behavioral detection. Are multiple alerts triggering separate investigations for the same incident? Evaluate the possibility of consolidating them. Then measure the issues that are actually detected and the work required to address the alerts.
👉 Which metrics should you display, and how should you organize your dashboard? Our article on the IT Performance Dashboard explains these choices in detail. To determine which components to monitor and which alerts to set up, check out our guide to IT monitoring.
Exploring Data Using Natural Language
Exploring observability data often requires knowing how to query it. Natural language reduces this technical barrier: the user simply states what they’re looking for, and the assistant handles the construction of the queries.
“Which services have seen an increase in error rates since 2:00 p.m.?”
Based on this question, the assistant queries the connected sources and displays the results. The user can then drill down further:
- “Focus on the payment service.”
- “Compare its error rate to the same period yesterday.”
- “Display the logs or traces associated with these errors.”
For an employee who is not very familiar with query languages, this provides more direct access to data exploration.
For an expert, this makes it possible to delegate the writing of queries and focus on the leads to investigate.
Its value, therefore, goes beyond simply simplifying a query: the assistant guides a process of exploration that becomes more focused as results are returned. The user retains control over the analysis and verifies that the selected time period, environment, and filters align with their question.
👉 To learn more about load times, Core Web Vitals, and caching, check out our article on web app performance. Our guide to mobile app performance covers topics such as interface responsiveness, memory and battery usage, and network constraints.
Assist with diagnostics and summarize incidents
Feedback from the field: complex investigations that now take just a few minutes, compared to a full day previously
Alan, an engineer at Qim Info, describes complex investigations that now take 30 to 60 minutes, compared to a full day previously. This example illustrates the potential benefit; it remains to be measured in each specific environment.
The assistant can explore multiple sources, correlate symptoms, and develop well-supported hypotheses. This provides the team with an initial analysis to verify and investigate further.
Errors have been increasing since 2:00 p.m., following a deployment. To investigate their cause, the assistant can examine:
- which services and requests are affected;
- what has changed in the logs and traces;
- whether the symptoms began before or after the deployment;
- whether unmodified services exhibit the same errors.
If errors occur before deployment, the assistant must explore other possibilities. The team verifies the evidence and confirms the cause; the fact that the error occurred close in time to a production release is not sufficient to establish it.
The assistant can also compile the results of the investigation into a structured report: timeline, affected components, observations, and remaining hypotheses. A colleague reviewing the incident can see what has been examined, the supported conclusions, and the questions that remain unanswered.
Field Feedback: Faster Diagnosis with Dynatrace Davis
“For a mission-critical banking application (Java/WebLogic) experiencing significant slowdowns and outages in production, I used Dynatrace Davis to speed up the investigation. The AI correlated spikes in transaction response times with application servers and ruled out several possibilities (database, CPU, network, heap), quickly directing the team to the application layer.
A thorough analysis of the methods and threads then revealed that each request recompiled the same XSL stylesheets behind a global lock: up to 213 of the 239 threads were blocked, and there was also a native memory leak. The identified fix involved caching the compiled templates. The diagnosis took a few days, whereas several weeks of investigative meetings might have been necessary. Davis facilitated the triage and reduced alert noise; pinpointing the exact cause remained the team’s job.”

💡 Qim info’s tip: Ask the assistant to specify what supports each hypothesis and what might call it into question. A useful investigation should enable the team to decide what to verify next, based on verifiable evidence.
How Did We Reduce a Global Bank’s Cloud Costs?
Eighteen months after migrating from an on-premises platform to the cloud, the results fell short of expectations. Find out how Qim info stepped in to resolve the issues and reduce operating costs. The Case Study
Example: Two real-world incidents replayed to test AI-based diagnosis
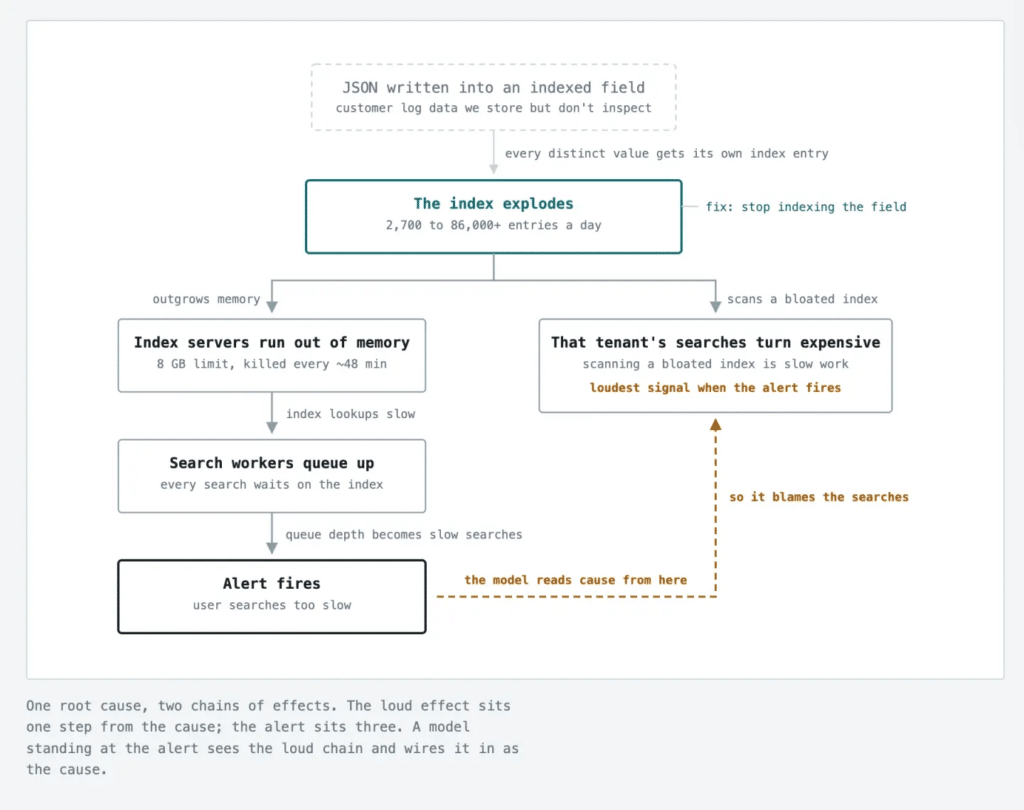
The cause was correctly identified in 1 out of 16 tests using telemetry alone, compared to 15 out of 16 with structured context data in the system: this is the result of an experiment conducted by Grafana on a real-world incident, replayed in two different configurations.
In this first test, the Knowledge Graph helps the agent trace back several steps prior to the alert. A second incident is used to verify whether this benefit holds true in a different context.
1️⃣ The symptom: log searches become slow.
A change in the indexed data causes an index to grow until it exceeds the available memory. The servers repeatedly restart, and searches slow down. A spike in query activity also occurs: this may appear to be the cause, but it is actually a consequence of the problem.
2️⃣ The test: send the alert to an AI agent.
Grafana replays the incident 16 times per configuration:
- with access to telemetry only;
- with access to telemetry and the Knowledge Graph, which describes, among other things, the dependencies between components.
3️⃣ The results: a marked difference in this case.
| Configuration | Correct cause identified |
| Telemetry only | 1 out of 16 tests |
| Telemetry and Knowledge Graph | 15 out of 16 tests |
Without the graph, the agent attributes the high query activity to this cause in 10 out of 16 trials.
Key takeaway: In this first case, the Knowledge Graph enabled the agent to trace the root cause of the slowdowns much more often, rather than stopping at high query activity, which was merely a symptom. The fix involved stopping the indexing of the affected field.
4️⃣ A second incident where the graph did not provide any significant benefit.
Grafana also simulated an incident caused by a slow backend: requests were piling up in the service that was calling it, eventually causing it to shut down due to a lack of memory. The decisive evidence was found in a log line identifying the backend in question, not in the Knowledge Graph.
Result: 8 correct diagnoses out of 16 using the graph, compared to 7 out of 16 using telemetry alone. The difference is not statistically significant. In the unsuccessful attempts, the agent missed the decisive log line, whether or not a graph was used.
💡 Qim info’s perspective: The goal is not to gather as much context as possible, but to make available the information that truly sheds light on the incident: dependencies between components, metrics, logs, traces, or recent changes. The Knowledge Graph significantly improved diagnosis in the first test, but showed no notable benefit in the second. These results, obtained from two replayed incidents, are not guaranteed to apply to all environments.
What are the prerequisites for leveraging AI in observability?
To speed up investigations, AI must be able to analyze the right signals and produce results that the team can verify. There are three key steps to prepare.
Actionable data
Verify that the assistant has access to the components, dependencies, and signals relevant to the question asked: metrics, logs, traces, and deployment events. The data must cover the incident and a relevant comparison period.
Consistent timestamps, clearly identified services and versions, and links between signals make analysis easier. Also look for gaps in data collection, filtering, or sampling: a tool that doesn’t detect calls to a database may overlook their role in a slowdown.
💡 Qim info’s tip: Check where the assistant searched and what data it had access to. An undetected error may simply lie outside its scope of analysis.
Access, Privacy, and Data Processing
Define:
- accessible sources and environments,
- the identity used to query them
- and the individuals authorized to view the conversations and reports.
The assistant must comply with the access rights established for this purpose.
Before transmitting any data, remove unnecessary fields and mask sensitive information that should not be disclosed, while preserving the context necessary for diagnosis.
Check with the provider to find out where the data is processed, which services receive it, how long it is retained, how it is deleted, and whether it is used to train models. Simply knowing where your telemetry data is stored is not enough to answer these questions.
How Did We Modernize the Monitoring of a Tax Agency’s Business Applications?
Recurring slowdowns disrupt internal processes, and the existing monitoring capabilities were limited. Learn how our teams deployed an observability solution to understand and resolve these issues. The Case Study
Guidelines to Establish Before Entrusting an Investigation or Task to AI
Ask the assistant to present:
- the evidence supporting his diagnosis,
- the scope of the analysis
- and the remaining uncertainties.
The team must be able to review the evidence and decide what to check next.
If the tool can interact with the system, define its permissions before using it. A correct diagnosis alone is not sufficient to authorize a restart in production.
| Question | Example of a rule to define |
| What can he do on his own? | Review the specified sources and prepare a report within the authorized scope. |
| Which actions should be approved or prohibited? | Designate who approves a restart or a change in production; prohibit actions outside the scope. |
| How do you evaluate the results? | Check the results, keep a record of the action, and plan for a way to reverse it when possible. |
Which use case should we start with, and how should we evaluate the results?
We suggest a simple testing protocol.
1️⃣ Choose a specific, recurring task.
For example: identifying errors in a service over a given period. Define the expected result before the test.
“Testing AI on our observability” is too broad to draw a useful conclusion.
2️⃣ Prepare a few representative test cases.
- Select cases that are relevant to the task, with a verified reference result.
- To test the diagnostic assistance, use documented incidents, using the data available at the time of the investigation.
- Do not provide the assistant with a report that already contains the solution.
- Include a case where the information is insufficient to verify whether the assistant flags this limitation rather than proposing an unsupported conclusion.
3️⃣ Compare the standard method and the assisted method.
Compare the two methods using the same scope, the same data, and the same success criteria.
| To be measured | What to Examine |
| Total time | Research, drafting requests, verification, and corrections. |
| Accuracy | Accuracy in relation to known facts; errors; significant omissions; and unsupported conclusions. |
| Verification Process | Checks and revisions required before using the result. |
| Cost of use | Use of the assistant and additional requests, when billed. |
🚨 Watch out for a bias: someone who already knows the solution can solve the problem faster. A test run allows you to evaluate the tool, but it’s not enough to demonstrate the benefit under real-world conditions.
4️⃣ Make your decision based on criteria established in advance.
For example: continue using the tool if the total time is reduced, without compromising accuracy or exceeding the accepted cost.
If the test is successful, proceed with a limited rollout under real-world conditions. Before a broader deployment, also evaluate the costs of configuration, integration, and maintenance.
Feedback from the field: at least 2 hours saved with Grafana Assistant
Haytham, an engineer at Qim info, needed to configure Grafana Alloy to receive only OTLP data and forward it to Grafana Cloud.
Rather than sifting through the documentation to simplify the default configuration, he asked Grafana Assistant to generate the necessary files.
During deployment, a conflict with an existing Kubernetes resource caused an error. The assistant suggested that he deploy Alloy under a different name.
Result: at least two hours of trial and error saved, according to Haytham’s estimate.
What are the trends in AI for observability?
More comprehensive investigations. Assistants can chain together queries, test hypotheses, and generate a well-documented report. Metrics, logs, and traces are contextualized within the system: dependencies between services, recent changes, and team procedures.
Integration with the team’s tools. The assistant can join conversations in Slack or Teams, create a ticket, or share a report. The goal is to streamline the process from identifying an issue to investigating it, and then to the next step.
Toward AI-powered SRE. The goal is to detect and resolve certain incidents without human intervention at every stage, in order to reduce on-call demands. SRE agents are moving in this direction, with actions that are either pre-authorized or subject to validation depending on their impact.
Preparing for these use cases starts today: making telemetry and context accessible to AI, then testing diagnostics and intervention rules within a defined scope.
How did we diagnose performance issues in an insurance group’s business applications without disrupting existing environments?
Our teams used the Rapid Application Performance Diagnostic to identify the root causes of the slowdowns and propose a prioritized action plan. The case study
Where to start?
AI can speed up detection, investigation, and diagnosis if it has useful data and if its findings remain verifiable. The right starting point depends on your situation:
- Your monitoring is still fragmented: bring metrics and logs together, standardize service names and timestamps, and use a common standard like OpenTelemetry when appropriate. Data quality and accessibility are the first step.
- Your data is solid, but you’re overwhelmed by alerts: Start by detecting deviations from normal behavior and grouping alerts related to the same incident. After a few weeks, assess the performance issues detected and the time spent on alerts.
- Your telemetry is properly connected and your investigations are well-structured: test the diagnostic process on a few past incidents using the four-step protocol described above. Initially, limit the assistant’s role to analysis only; any ability to take action must be subject to separate authorization.
💡 Qim info’s tip: No matter where you start, an AI response is still something to check before drawing a conclusion.
What kind of support does Qim Info offer?
Qim Info helps you choose an initial use case, prepare the data and access permissions, and then test the AI in your environment. We compare the results, the validation process, and the costs to decide whether to proceed, adjust, or abandon that use case.
Talk to our Performance & Observability team about your first use case.
🧪 At Qim info, we’re also experimenting with
An internal challenge: testing Grafana Cloud ’s AI assistant by creating a dashboard using public Swiss data.
Our teams built the “Awesome Swiss Dashboard,” which includes regional train schedules and weather data accessible via public APIs.
This experiment explores the use of AI to assist in dashboard creation. It complements our work on observability, though it is not intended as an incident diagnostic test.