We prefer to warn you: this article has nothing to do with the “Commodore 64 console of the 80’s” but with Komodor, this solution that facilitates the management of your Kubernetes clusters. And Benjamin, an engineer in the Cloud & DevOps Solutions department of Qim info’s expertise centre, will be your guide for your first steps on the platform.
Before explaining why Komodor is a great tool, let's take a look at what Kubernetes is...
Kubernetes is an open-source application container orchestration tool distributed across a set of compute nodes. It improves efficiency when delivering and updating applications for end users. In addition, it also provides better resilience to incidents and failures while guaranteeing scalability.
However, Kubernetes also brings its share of new issues, especially in troubleshooting and debugging.
For example, let’s take a developer who wants to understand why their application doesn’t work during delivery. They can use tools like the Kubernetes Dashboard or the kubectl command line to search for information. However, these methods can be complex to use if you lack time or experience.
This is why products like Komodor have appeared on the market.
So, what is Komodor?
Komodor is a SaaS administration, monitoring, and debugging / troubleshooting tool that integrates with Kubernetes clusters.
It keeps an eye on each component’s and application’s health and can integrate with third-party solutions—Ops Genie, Slack, DataDog, Sentry, and more—to alert you as needed. It also integrates with source managers like Gitlab or Github to correlate commits with events on the cluster.
It also displays recommendations and best practices for declaring YAML files in Kubernetes.
How much does it cost?
Nothing! Komodor is a freemium with a free license for up to 50 nodes (all clusters combined). However, data retention time is only four hours.
There is a Business and Enterprise plan with additional features, such as using the Komodor API or SSO.
Let's learn more about the tool!
Prerequisite
- Have access to a Kubernetes cluster connected to the internet.
- Have the kubectl et helm command line client.
- Have sufficient permissions to create the resources.
We recommend the role of ‘cluster-admin’. Specific permissions are listed here.
Start by create an account. You can use SSO services like Google, Github, or Microsoft. Once your account is created, deploy an agent to your Kubernetes cluster with the Helm command line.
Simplify Kubernetes Operations in 5 minutes.
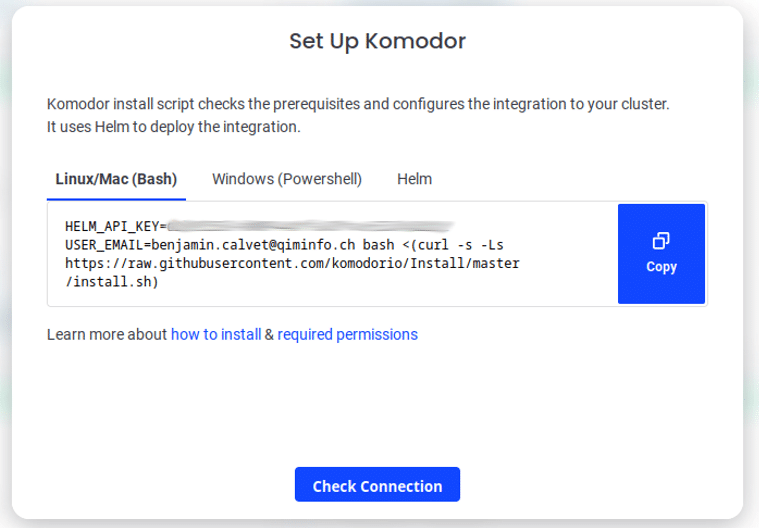
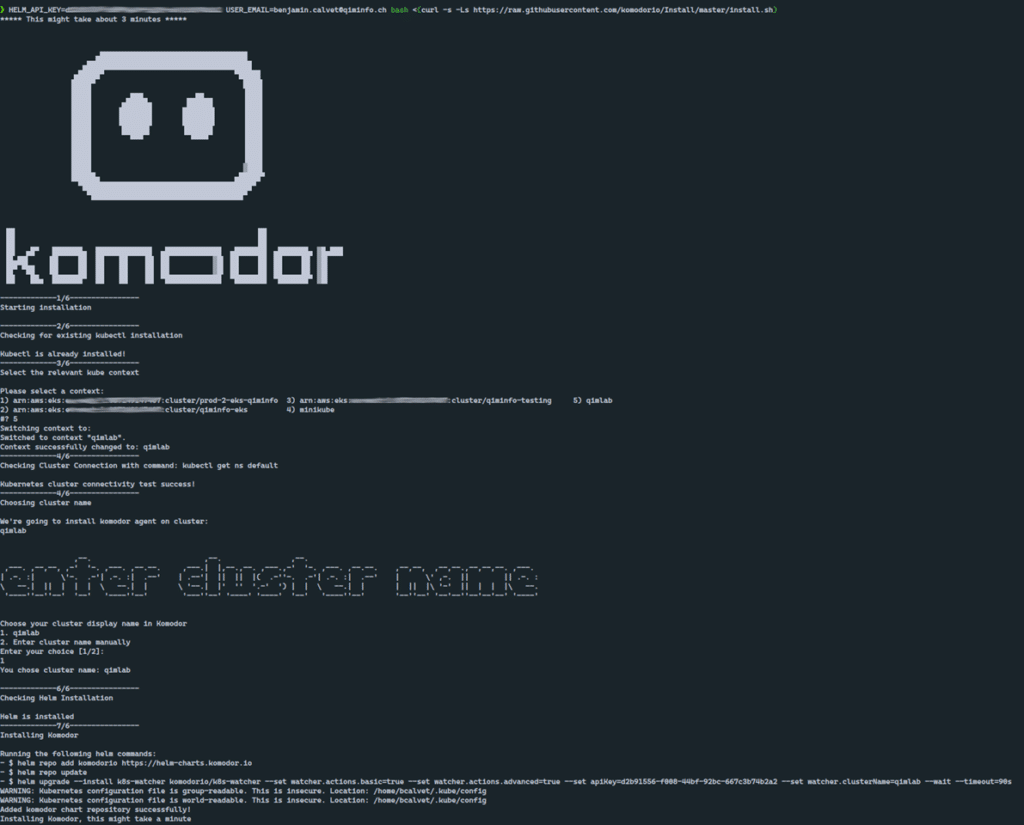
Choose which Kubernetes context should be used to deploy the Komodor agent as well as what name to display in your cluster’s Komodor interface. Once you have entered and validated this information, return to the web interface and click “Check Connection“.
Did you get a confirmation message after the installation? Great.
Let's have a quick look at the interface...
You can see Komodor « Services »in the main view. These are Deployments / Daemonsets / Statefulsets objects as defined by Kubernetes, i.e., all applications present on the cluster.
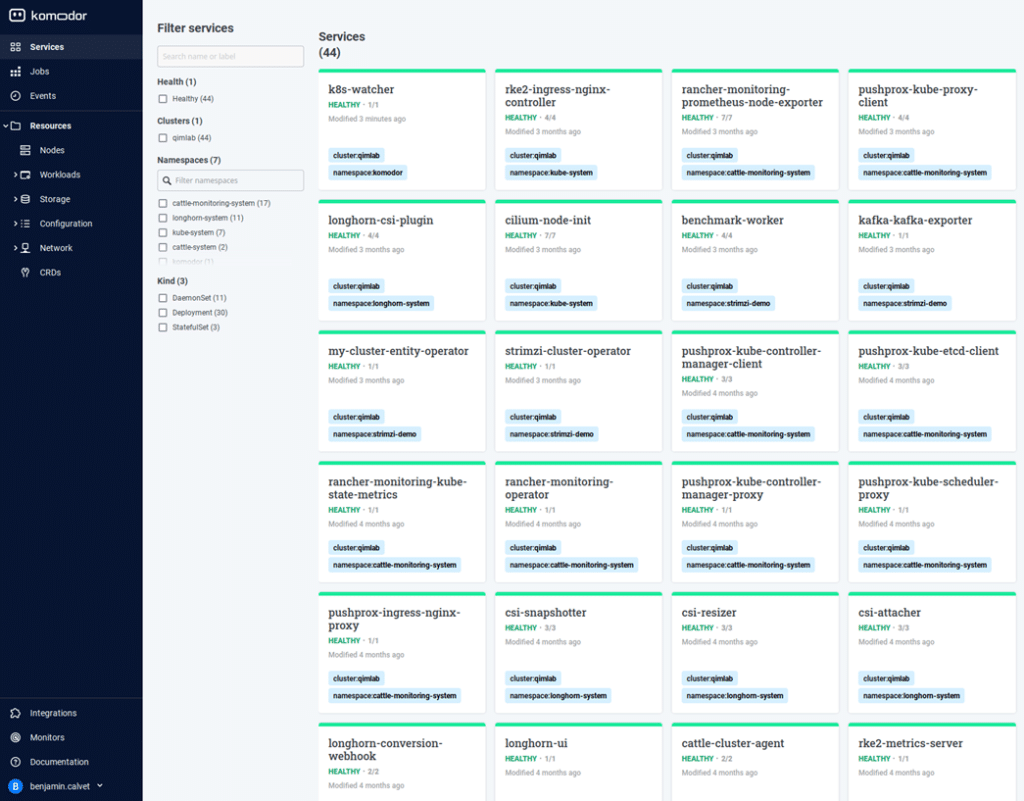
On the left, the selection menu is used to browse the different cluster resources. You will see “Jobs”, as well as an “Events” entry that lists all the events of all the “Services”. The Kubernetes “Resources” view (Nodes/Storage/Workloads..) is similar to the kubernetes-dashboard project.
Integrating third-party software in the Komodor tool
This feature is available in the lower section of the Komodor menu.
Here, we can use Slack as an example to receive alerts in case of incidents on “Services”.
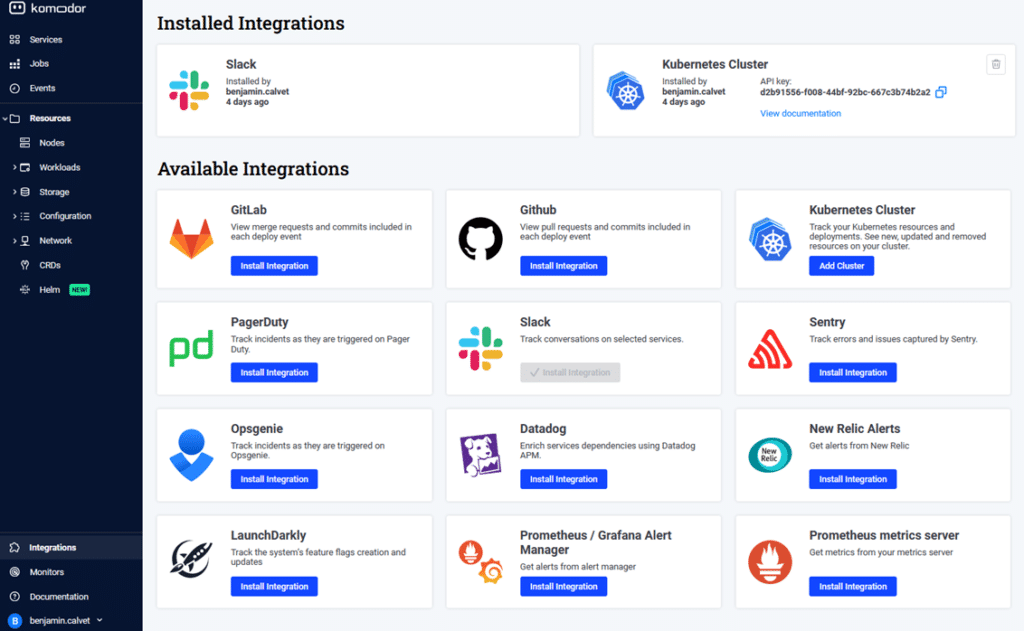
In “Integrations” choose Slack, then link the account.
Next, create a “Monitor” object that will allow you to send alerts to the correct Slack channel.
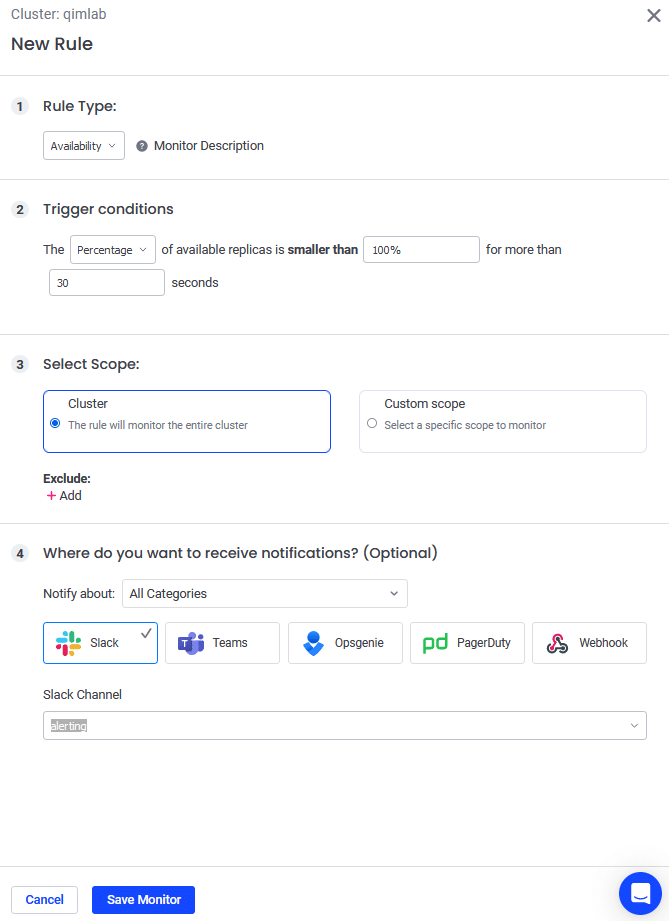
Now that the alerts are set up let's test a project database deployment.
Create a StatefulSet ‘mydb-postgresql’, which will be deployed in the Kubernetes namespace ‘my-db’:
- kubectl create namespace my-db
- kubectl config set-context –current –namespace=my-db
- helm install mydb bitnami/postgresql
After installing the Helm chart, the application appears in the “Services” view. To view the details of events collected by Komodor, click on “Service’.
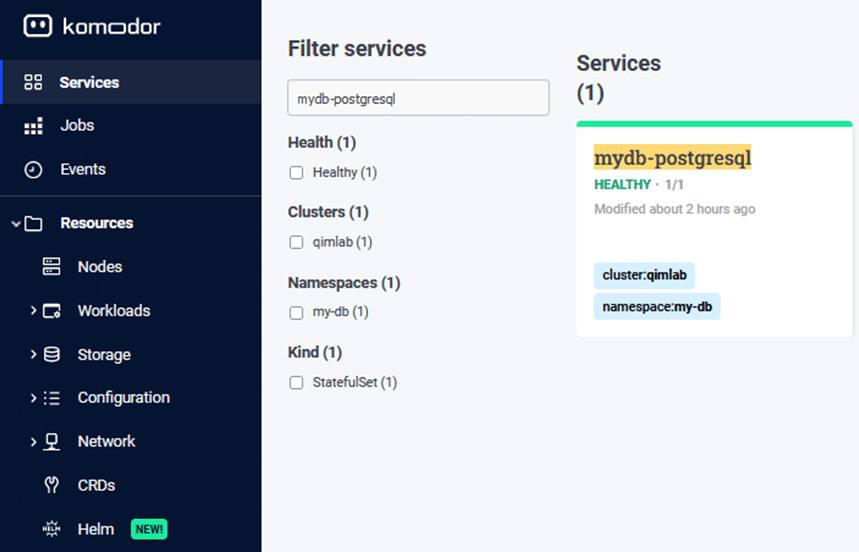
Once this subject is deployed and operational, let's try a random change on the Kubernetes StatefulSet object
Change the version of the Docker image to a newer version:
kubectl patch statefulset mydb-postgesql –type=’json’ \
-p='[{“op”: “replace”, “path”:”/spec/template/spec/containers/0/image”, “value”:” postgresql:15.1.0-debian-11-r32″}]’
The change failed! An alert is immediately sent to the Slack channel:
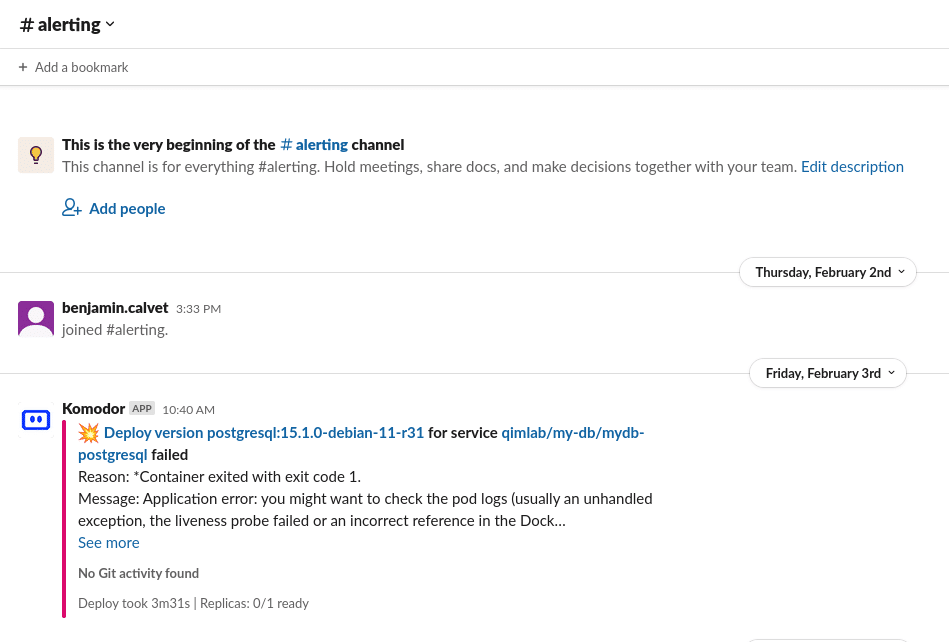
With a Back-off pulling image”docker.io/bitnami/postgresql:15.1.0-debian-11-r32 error, we observe that a new event has appeared in Komodor:
The “Availability issue” item describes the incident. This is the view where you can identify what’s wrong and analyse it with “Live Pods & Logs” and Pod events.
Looking at the events section on the Pod, you will notice that the image is unavailable on the remote repository, and therefore, Kubernetes cannot start the container.
The “Deploy” event in red indicates that a modification has been made to the StatefulSet object: See the differential that provides a line-by-line comparison of the changes between the two versions.
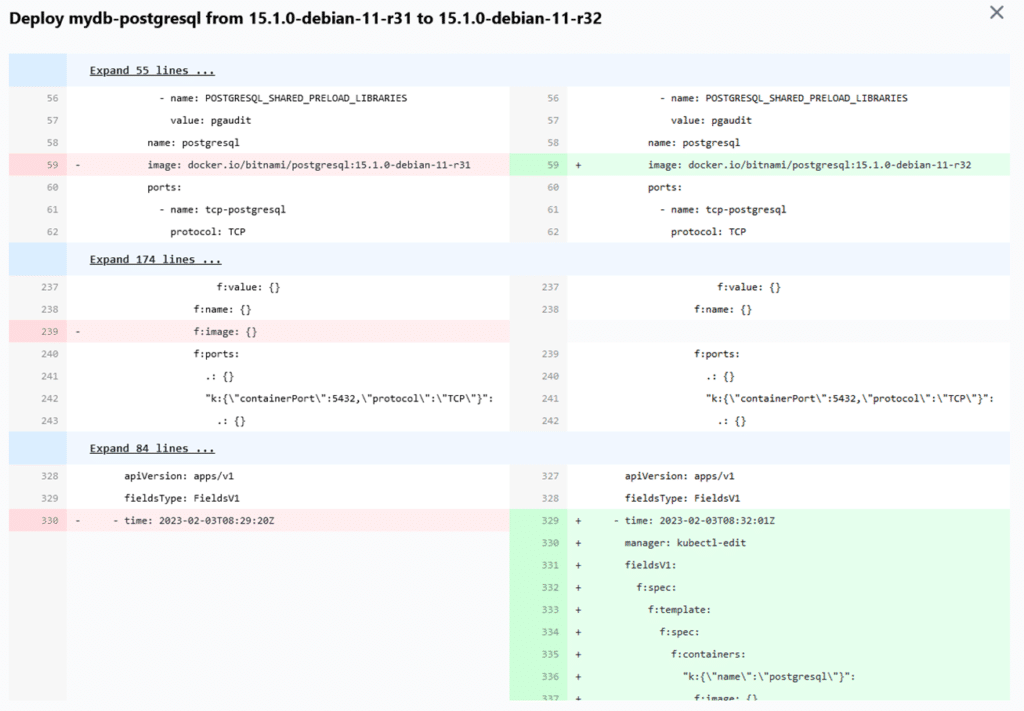
From this view,. you will also find the “Rollback” option to return to the previous state.
But pay attention to how your applications are managed! If they are in “GitOps” mode, this action will be of no use, as any changes will be automatically overwritten by your Continuous Delivery tool, for instance ArgoCD.
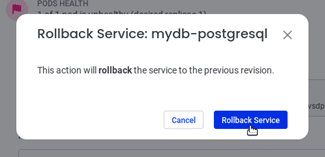
Once the “RollBack” is carried out, your service is operational again with the old version of the image.
Another case: You just deployed a new version, but the Pod in Kubernetes crashes. Komodor displays the last crash logs to understand the error’s cause.
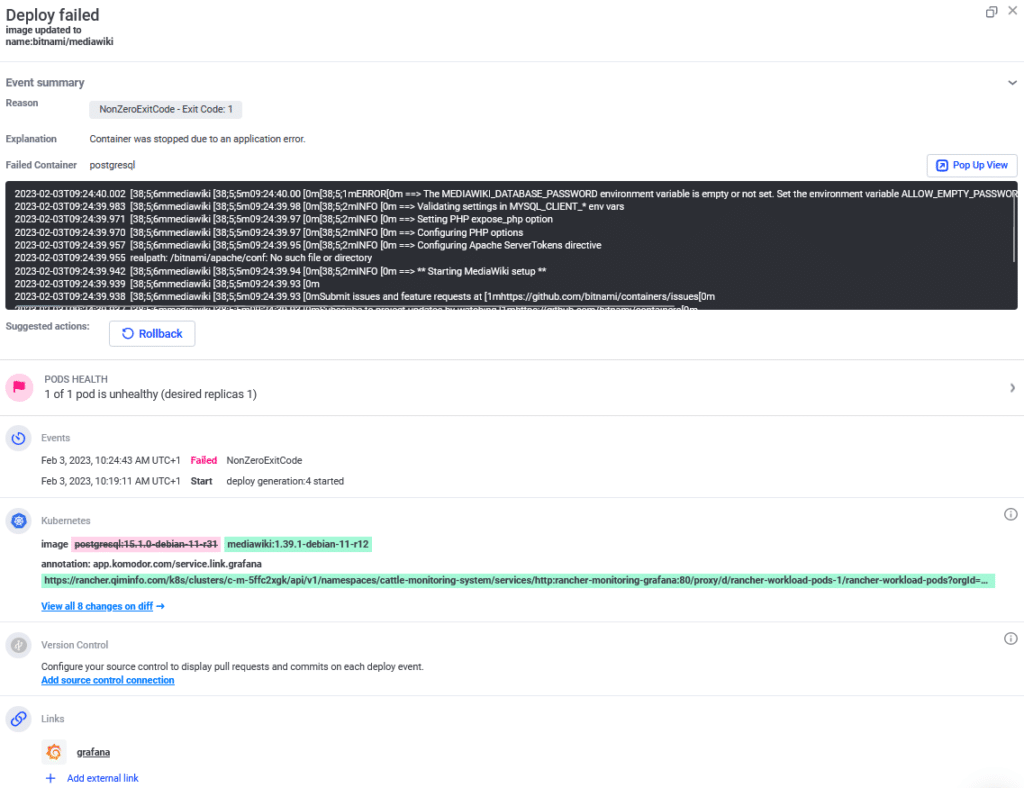
And with Komodor, you can also embeded external links as annotations!
Do you want to add a link to monitoring with Grafana? All you have to do is annotate the Statefulset object in Kubernetes:
kubectl annotate sts mydb-postgresql app.komodor.com/service.link.grafana-overall-system-health=my-link.grafana.com
Komodor will consider these annotations and display a link in the event’s details section. This link will redirect you to a Grafana table displaying CPU/Memory/IO metrics…against mydb-postgresql statefulset.

Tips on best practices
In “Services”, there’s an “Info” section that provides information on the application and offers “Best Practices” to improve the compliance of your Kubernetes resources.
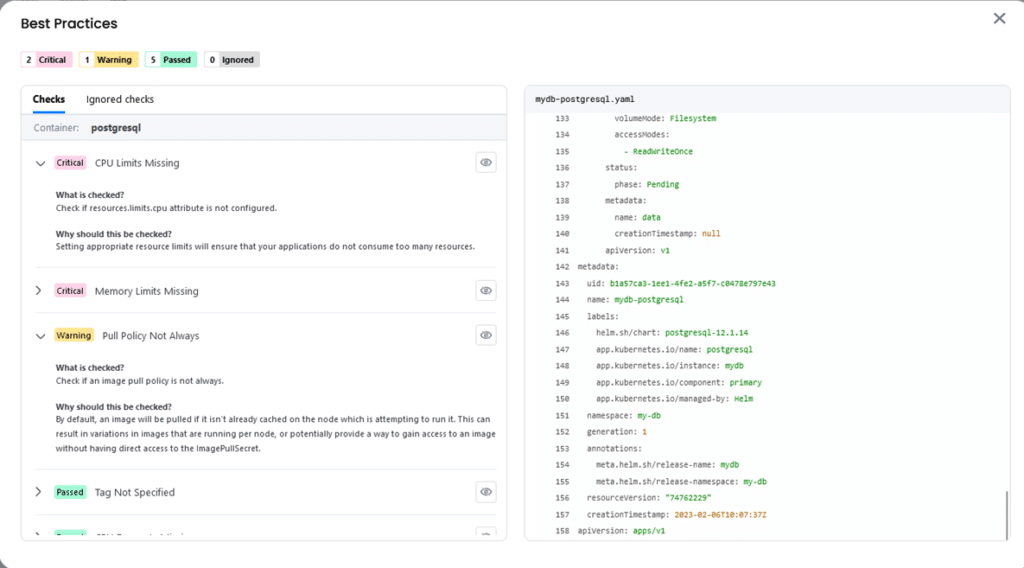
In a nutshell, why use Komodor?
It's easy to use
Just create an account and an agent to deploy on your cluster, and that’s it! The menus are clear and important information is quickly displayed. Be careful to avoid getting lost in the details section.
It integrates with third-party software
It provides DevOps greater visibility
Komodor centralises information to investigate a problem and, in general, provides better insight during debugging phases.
It integrates easily with tools such as Grafana and Datadog on deployments and can be used to administer the Kubernetes section—node maintenance, rollbacks, editing resources in YAML, etc.
In short, if your DevOps team doesn’t have the time or resources to maintain an on-premises debugging/resolution tool for Kubernetes, Komodor is the right solution for you!


