
IT Performance Indicators are used to measure the efficiency, security, and cost-effectiveness of IT systems. Key points:
- They allow you to monitor the availability of services.
- They help detect performance degradation.
- They vary depending on the IT environment.
- A good indicator must be linked to a specific objective, have an alert threshold, and enable concrete action.
What is an IT Performance Indicator?
Definition and Benefits
An IT Performance Indicator is simply a metric that tells you whether your IT is functioning properly.
It is also a metric that helps IT teams make the best decisions. It contributes to reducing expenses, strengthening security, and allocating resources more efficiently.
Specifically, it can measure:
- the availability of an app,
- the time required to resolve an incident,
- a server’s performance,
- compliance with SLAs,
- the cost of an IT service.
💡Qim Info Tip: The goal isn’t to just rack up numbers. Metrics are primarily used to understand what’s working, what’s deteriorating, and where action is needed most.
A Brief Glossary of IT Performance.
For example, a company wants to improve the availability of its application.
The metric is measured, displayed on a dashboard, and then used to manage performance.
IT Performance Indicator: availability rate.
IT Performance Measurement: monthly calculation of availability based on monitoring data.
IT Performance Dashboard : display of the current rate, its trend, and outages.
IT Performance Management : analysis of the causes of downtime and implementation of actions to achieve the target.
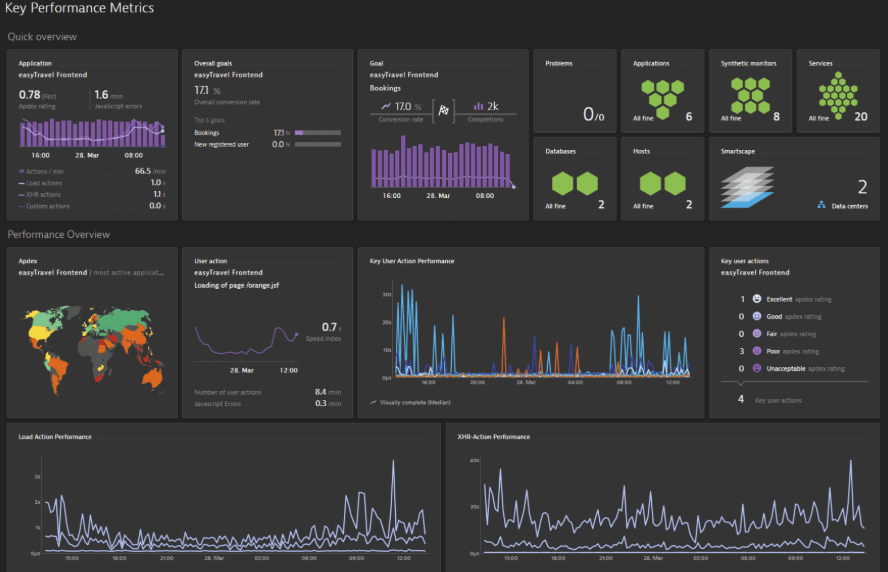
Example of indicators
Difference Between IT Performance Indicators, IT Metrics, and IT KPIs
A metric measures, a performance indicator evaluates, and a KPI drives a priority.
| What is it? | Examples | |
| IT metric | A raw measurement that describes what is happening at a given moment. | Average response time: 200 ms. Number of reported incidents: 25 this month. Network uptime: 99.5%. |
| IT performance indicator | A metric used to determine whether performance is satisfactory. | Response time compared to a threshold of 150 ms. |
| IT KPIs | A performance indicator deemed a priority and directly linked to a key objective. | Keep 95% of requests under 150 ms. |
All KPIs are based on metrics, but not all metrics necessarily become KPIs!
IT KPIs, or key performance indicators, use these metrics to measure the achievement of a specific objective. They are therefore linked to a target, a time period, and, ideally, an action to be taken in the event of a deviation.
Example:
- Objective: Maintain availability above 99.9%.
- KPI: Network availability rate.
- Result: 99.5%, target not met.
Example:
- Goal: Reduce the number of recurring incidents by 20% within six months.
- KPI: Change in the number of recurring incidents over the period.
In short, a metric shows what is happening. A KPI tells you whether you are meeting your goal.
Who can benefit from IT performance indicators?
IT Teams
IT Performance Indicators enable them to:
- monitor the effectiveness of operations,
- improve incident management,
- minimize downtime,
- optimize the allocation of technical resources,
- prioritize their actions,
- anticipate problems before they affect users.
The Leaders
IT Performance Metrics provide them with detailed information to streamline investments, drive digital transformation, and evaluate the return on investment of IT initiatives.
Partners and Suppliers
In the context of service level agreements (SLAs), these metrics make it easier to track performance commitments and promote effective cooperation between companies and their suppliers. They help ensure high-quality service and identify potential breaches of contract.
What are the main types of IT performance indicators?
Availability and Operational Performance Metrics
These metrics make it possible to assess the effectiveness of IT networks and services while evaluating their resilience, reliability, and performance in light of the company’s requirements.
- Downtime: the total period during which an IT service or infrastructure is not operational, which directly affects operational continuity and user satisfaction. It is crucial to minimize downtime to ensure the availability of essential services.
- SLA (Service Level Agreement) Compliance: the percentage of contractual service level targets met. This metric is used to assess compliance with agreements made with customers and partners.
- Service availability: the ratio of the period during which a service is available to users to its total expected duration. Ensuring consistent performance of IT applications and services requires high availability, which is a crucial factor.
- MTTR (Mean Time To Repair): the average time required to identify, diagnose, and resolve an incident. A low MTTR indicates that IT teams are able to respond quickly to outages and minimize their impact.
- MTBF (Mean Time Between Failures): the average time between two consecutive failures of a piece of equipment or a system. A high MTBF indicates greater reliability of IT infrastructure, thereby minimizing potential downtime.
IT Support and Incident Management Metrics
They measure the ability of IT teams to handle, process, and resolve requests and incidents. Examples:
- first response time;
- average resolution time;
- first-contact resolution rate;
- number of open tickets;
- incident backlog;
- compliance with SLAs;
- user satisfaction after service.
Cybersecurity Metrics
They measure risk exposure, threat detection, and the effectiveness of protective measures. Examples:
- number of security incidents;
- average detection time;
- average duration of isolation;
- percentage of critical fixes applied;
- number of critical vulnerabilities that remain unresolved;
- percentage of accounts protected by MFA;
- click-through rate for phishing simulations.
That said, the line isn’t always clear-cut. A security incident can also be handled in an ITSM tool and appear in support statistics.
💡Our take at Qim info: The simple rule is that if the metric measures the quality of handling a request or a system outage, it falls under IT support ; if it measures a risk, a threat, or a protective measure, it falls under cybersecurity.
IT team productivity indicators
They measure teams’ ability to produce, deliver, or process work efficiently.
Examples:
- volume of changes deployed;
- average time to production;
- percentage of tasks completed on time;
- time spent on hands-on activities;
- the team’s output over a given period.
💡Our take at Qim info: These metrics should be used with caution. For example, a higher number of resolved tickets doesn’t necessarily mean better performance if quality declines, incidents recur, or users remain dissatisfied.
As part of the work carried out by our development and operations teams, we focus on:
- Deployment success rate, defined as the percentage of flawless implementations, which demonstrates the robustness and excellence of development procedures.
- Average delivery time—the time required to move from the design phase to the delivery of an application—is a key factor in ensuring team flexibility and customer satisfaction.
Financial and Budgetary Indicators
They answer questions such as: How much does an IT service cost? Are we staying within budget? And are the investments producing the expected results? Examples:
- IT cost per user;
- average cost per ticket or per incident;
- operating costs of an application;
- percentage of expenditures allocated to maintenance;
- return on investment for an IT project;
💡Our take at Qim info: These metrics should not be analyzed in isolation. A reduction in costs may seem positive, but it can become counterproductive if it compromises availability, security, or service quality.
Examples of IT Performance Indicators to Track
The only rule is to select metrics based on the IT scope and the company’s objectives.
For example:
- For an infrastructure team: availability, latency, capacity, MTTR.
- For a service desk: first response time, first-contact resolution, user satisfaction, backlog.
- For cybersecurity: critical vulnerabilities, detection time, remediation time, MFA coverage.
- For IT management: adherence to the budget, cost per user, project value, and compliance with SLAs.
- For an application development team: error rate, deployment frequency, time to production, and post-release incidents.
How do you choose the right IT Performance Indicators?
A good indicator should help answer a specific question and make a decision.
Step 1: Identify what you’re looking to improve.
Step 2: Verify that each indicator meets several criteria:
- it is directly linked to an objective;
- it is based on reliable data;
- it can be measured regularly;
- it is understandable to the people who use it;
- it helps identify a discrepancy or deterioration;
- It leads to concrete action.
For example, tracking the total number of tickets doesn’t always provide much insight. On the other hand, measuring the percentage of tickets resolved within the expected timeframe allows you to verify whether the support team is actually meeting its commitments.
Step 3: Set a target or threshold. A response time of 250 ms, on its own, does not indicate whether performance is satisfactory. It becomes meaningful when compared to a target, an SLA, or a historical value.
Step 4: Automate data collection and analysis to reduce human error and facilitate rapid problem detection.
Step 5: Adjust the KPIs as needed. Since requirements change over time, it is essential to regularly reassess the importance of these metrics.
💡Qim Info Tip: Before adding a new metric to your dashboard, ask yourself what decision it will help you make. If the answer isn’t clear, the metric is probably unnecessary.
What tools should be used to track IT performance indicators?
They can be classified into various categories.
Monitoring and Observability Solutions
Monitoring tools such as Dynatrace, AppDynamics, and Datadog collect data and track:
- service availability;
- response times;
- the use of resources;
- application errors;
- the performance of servers, containers, and networks.
💡Qim Info Tip: The monitoring tools for a web app aren’t necessarily the same as those for a mobile app.
Visualization and Business Intelligence Tools
Grafana, Power BI or Tableau make it easy to compare results against goals, SLAs, or historical data.
Grafana is primarily used to visualize technical data from monitoring solutions or databases. Power BI and Tableau are better suited for cross-analyzing IT, financial, and business data.
💡Good to know: Having trouble navigating your Power BI dashboards? We’ve developed Meta BI, a standalone tool designed to simplify the monitoring of your Power BI environment.
ITSM Tools
ServiceNow and Jira Service Management provide data on, among other things:
- response times for the first reply;
- resolution times;
- the number of tickets;
- compliance with SLAs;
- the reopening rate;
- user satisfaction.
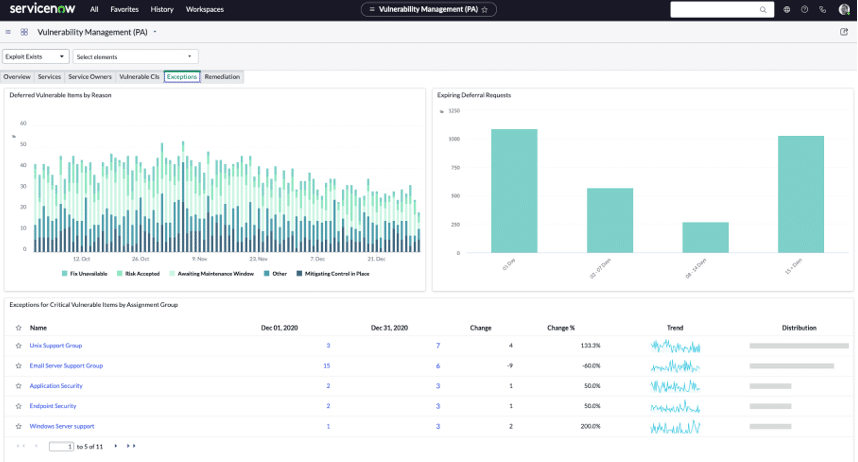
The interface of SNOW, the best-known ITSM tool
Cybersecurity Solutions
SIEM solutions, such as Splunk Enterprise Security, centralize and analyze security events.
What mistakes should be avoided when implementing IT performance indicators?
- Tracking too many metrics: An overloaded dashboard makes it difficult to identify priorities. It’s better to track a few truly useful metrics than a long list that’s rarely analyzed.
- Choosing metrics that aren’t linked to objectives: A metric may be easy to measure but not useful! Each IT Performance Indicator must answer a specific question and be linked to a business, operational, or financial objective.
- Using unreliable, incomplete, or poorly synchronized data, which can skew the analysis. Before tracking an indicator, you should verify its source and how it is calculated.
- Confusing activity with performance: A high volume of resolved tickets, deployed changes, or completed tasks does not necessarily mean that service quality is improving. These metrics must be supplemented by indicators of quality, stability, or satisfaction.
- Measuring without taking action: An indicator is only useful if it helps inform a decision. If no one knows what to do when a deviation occurs, the measurement risks remaining purely descriptive.
- Using metrics as a tool for individual performance monitoring: if misused, they can lead teams to focus on optimizing numbers rather than the actual quality of service.
💡Qim Info Tip: Before adding a metric, ask yourself what decision it will help you make. If the answer isn’t clear, it’s probably unnecessary.
How does Qim Info help your company optimize its IT performance indicators?
With its in-depth expertise and tailored approach, Qim info is a premier partner for optimizing your IT performance metrics.
Qim info partners with leading providers of monitoring and observability solutions, such as Grafana, Dynatrace, Cisco, AppDynamics, and OctoPerf. Our specialists are highly proficient in these solutions, as they use them on numerous client projects.
👉Check out our case studies on the Rapid Performance Diagnostic for an insurance group and on application observability for a Swiss tax authority.
By working with Qim info, you’ll benefit from strategic and technical support that ensures optimal and effective management of your IT performance metrics.
With Qim info, turn your metrics into powerful tools for performance and innovation!
FAQ
How many IT KPIs should you track?
There is no one-size-fits-all number. In practice, it’s better to track a few truly useful IT KPIs—often between 5 and 10 per area—rather than have an overloaded dashboard.
How often should the indicators be monitored?
The frequency depends on the metric. Critical data, such as availability or security incidents, can be tracked in real time. Costs, user satisfaction, and performance trends, on the other hand, are typically analyzed on a weekly, monthly, or quarterly basis.
The key is to adjust the frequency to the pace at which a decision can actually be made.
Which KPIs should be used to measure IT availability?
The key KPIs are uptime, total downtime, number of incidents, MTTR, and SLA compliance.